Enterprise level customer satisfaction reporting in PowerBI and Tableau
Build impressive PowerBI and Tableau reports based on the customer satisfaction data analyzed using TEXT2DATA service!
Analyze and report user feedback data in real-time using our Excel Add-In, Google Sheets add-on or programmatic api!
![]()
![]()
Advanced Reporting Options
Advanced reporting options let you generate reports under different measures and hierarchical views. By setting up "request identifier" setting in our Excel/ Google Sheets add-on or programmatic api, you might differentiate your report data per analysis context or per different employee running the data analysis.
Scheduled data refresh let you refresh reports from multiple sources (employees running analysis, often from different locations) almost in real-time!
What do you need to start creating reports?
To start creating reports yourself, you need to have:- "Enterprise" plan in our system, so your analysis results are being stored to your dedicated database,
- PowerBI (Free or Pro) or Tableau license,
PowerBI sample report [design view]
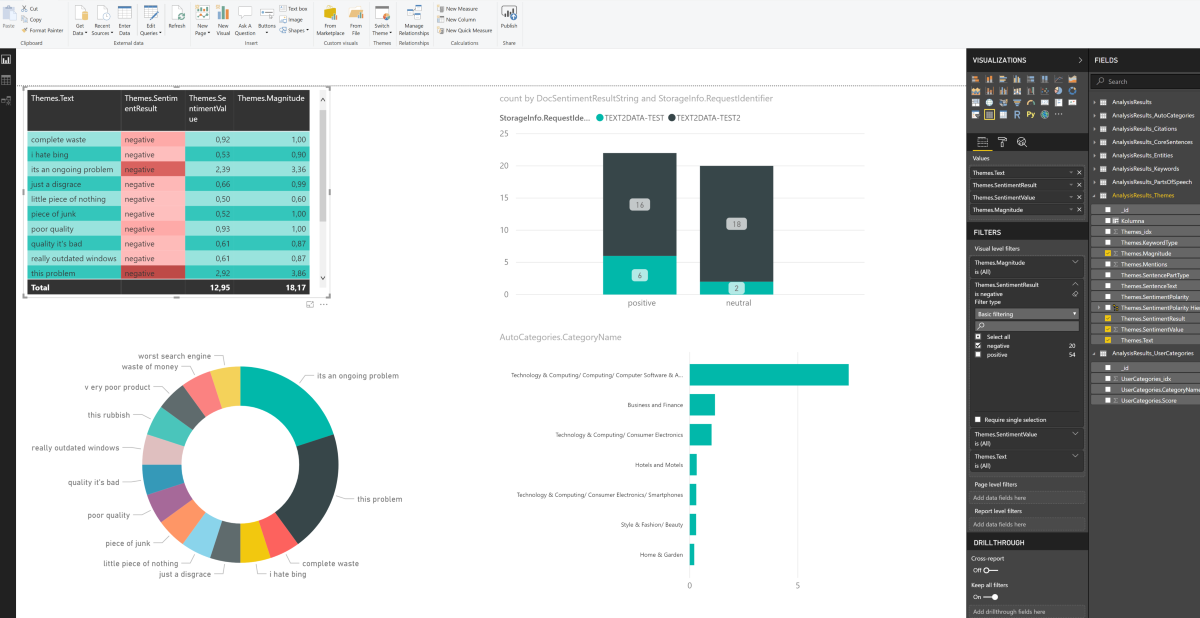
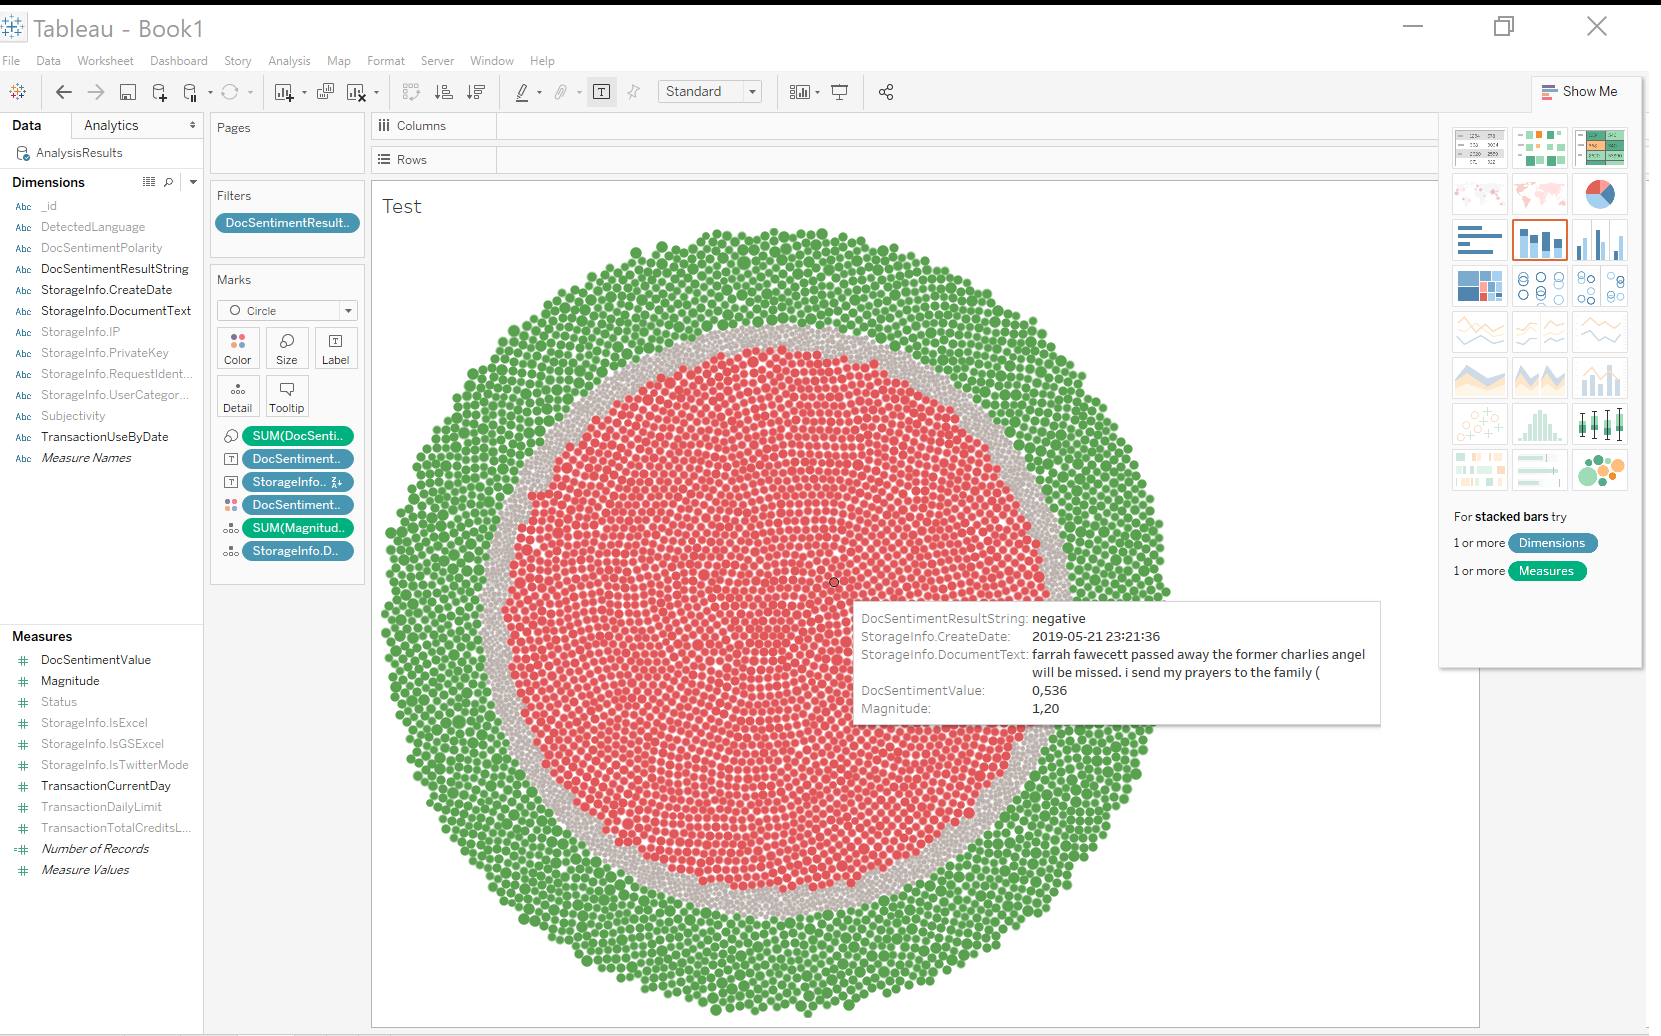
Tableau sample report [design view]
Multilevel, interactive reports
Reports can be fully interactive with drill-down functionality, embedded into your website or shared across your organization.
Sample report below, shows the fraction of data gathered on Twitter within 3 days that mention 'samsung' (using our Excel Add-In).
Data storage
Every time you analyze the data in our system, the results are being stored to your dedicated MongoDb database (available in "Enterprise" plan). You might access that data simply by setting up ODBC data source on your computer and using it as a data source in your reporting solution.
To register MongoDb data source on your system, you have to install Mongodb odbc connector, the current version is 1.02
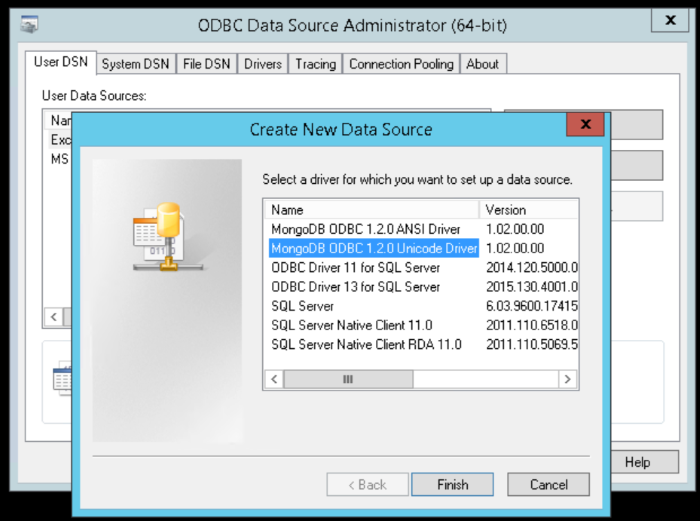
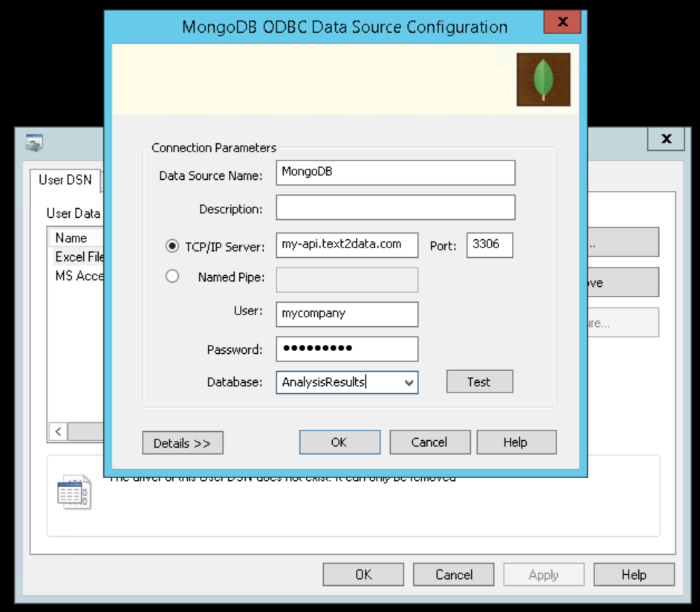
Once the ODBC data source is registered, simply go to your reporting program and use it as a data source
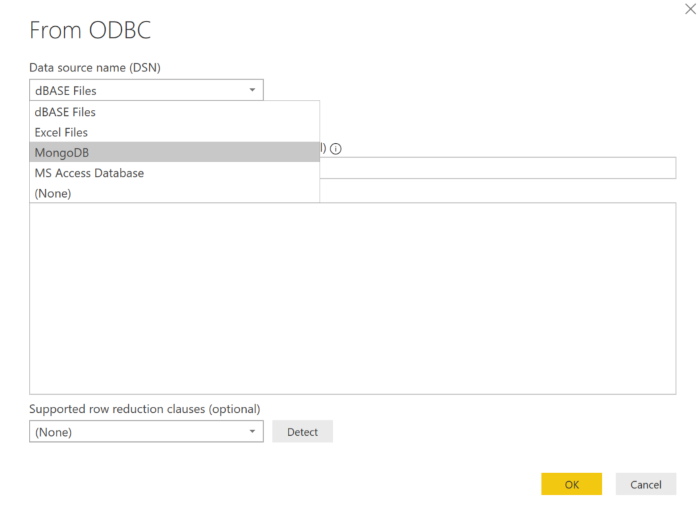
Created ODBC data source not only can be used in PowerBI and Tableau but also in Excel or any other reporting software supporting external ODBC data sources.
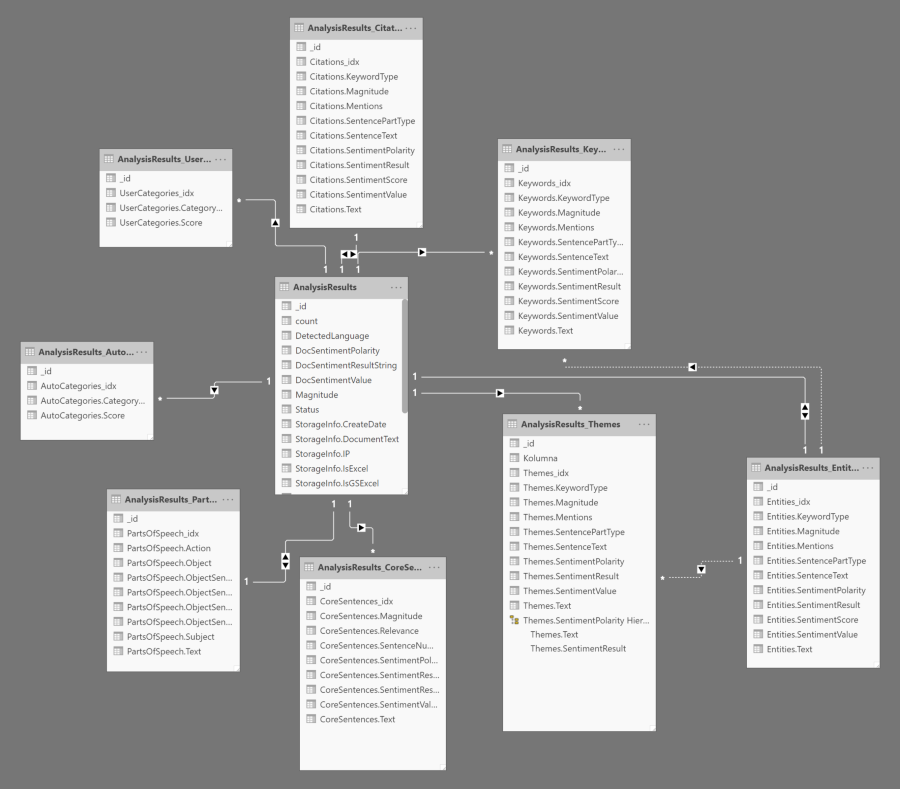
Data structure
Although the analyzed data is being stored to non-relational MongoDB database, it is still available as a relational structure within your reporting environment
The image below presents the data structure available within your reporting solution. It originates from json format being returned from our engine and resolves to one-to-many relationship tables.
For example, there is one main table "AnalysisResults" that has many themes "AnalysisResults_Themes" table, Enities "AnalysisResults_Entities" table, auto categories "AnalysisResults_AutoCategories" table, user categories "AnalysisResults_UserCategories" table etc...
All the related tables are being joined by common _id column.
Such a structure allows you creating really powerful reports under different contexts and view levels.
Analysis results table relations shown in PowerBI