What is customer experience (CX) ?
Customer experience (CX) is a customer’s perception and feelings caused by overall interaction with a brand, company, employee or a product. Why customer experience is so important ? Because a customer who is satisfied with services is more likely to become a loyal customer.
Everyday customers spend their time on sharing of opinion and experience with brands or companies through social media like Twitter or Facebook. Getting customer insight and reaching those who are not satisfied is so essential. Monitoring and analysing marketplace helps understand customers’ needs and preferences. To run a high quality analysis and generate powerful reports the proper tools are required.
Today we are going to show you how customers perceive Samsung smartphones and what they write about them on Twitter. To do research and run the analysis we use Social Media Monitoring Tool for Excel. Using the tool you can download real-time social data from Twitter or Facebook and run sentiment analysis on it. To build impressive reports based on the customer feedback we use Customer Experience Reporting tool. Thanks to PowerBi and Tableau integration you can generate customer satisfaction reports in real-time.
Downloading Twitter data.
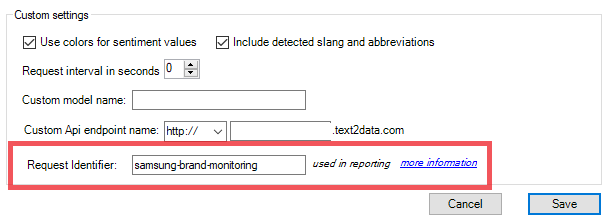
1) To start the research on customer insight open Microsoft Excel, open ‘Text2data’ tab, then open ‘Service Settings’. Provide ‘Request Identifier’ – name it whatever you want to, in our case we provided ‘samsung-brand-monitoring’ name. Save settings to provide changes and close the ‘Service Settings’ window.

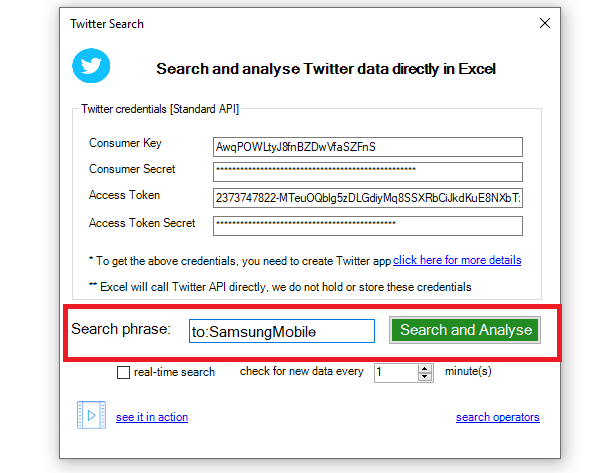
2) Click on ‘Twitter Search’ icon, provide ‘Twitter Credentials’ and ‘Search phrase’. We wanted to get to know what people write about Samsung smartphones. To receive more detailed data we provide ‘to:Samsungmobile’ phrase. The phrase downloads only these Tweets where user mentions the Samsung Mobile official Twitter account. You can provide same phrase on different companies – it depends on your needs and interests. Check ‘real-time’ search to download Tweets continuously, click on ‘Search and Analyse’. The Social Media Monitoring Tool starts to search new Tweets, the analysis results will be automatically stored in your dedicated reporting database (for clients using our custom api endpoint subscription).

3) Minimalize your Microsoft Excel window – let it work in the background. You do whatever you want to in the time. Collect the social data as long as you want to. In our case we were doing it for three days to get more accurate customer insight.
Generating customer experience report in PowerBi.
1) Once your ODBC data source is integrated with PowerBI, open it and to start generating your customer satisfaction report. (How to integrate ODBC data source with PowerBI)
2) Open ‘Fields’ pane, click right mouse button on ‘AnalysisResults’ and click on ‘Edit query’.
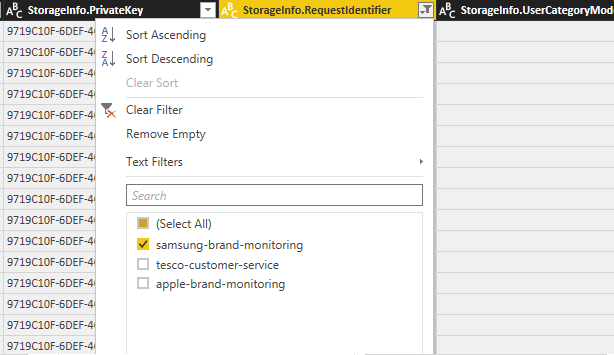
3) Find ‘StorageInfo.RequestIdentifier’ column, open ‘Filter’ and check the ‘Request Identifier’ you want to include in your report. In our case it is ‘samsung-brand-monitoring’ which we provided in ‘Service Settings’ in Excel before searching Tweets. The request identifier serves as reporting context which can be modified depending on the data being gathered e.g. an employee analyses data from Twitter regarding Samsung for one hour next, changes to gather the data regarding Apple. At the end of the day the employee has data to create one report on Samsung and another one on Apple.

4) Create report according to your preferences. Modify charts, colours and filters in ‘Visualizations’ pane.
Generated report on Samsung smartphones in PowerBI.
Below, you can find our quick report on Samsung customer satisfaction. The report presents table that contains document text, sentiment, date and magnitude. The charts present themes sentiment and stacked column chart 'themes count by day'.
According to the report, we can deduce that the most users are not satisfied with Samsung. There are more negative Tweets than positive. Going into greater depth on Tweets, we can notice last Android update caused a lot of issues with customers’ phones. Some of them have problem with the battery and its slow charging. Customers do not like the security patch and they reckon it as the worst one ever. However there are customers who are satisfied with the brand. Some of them enjoy phone design and like finger scanner.
The solution allows you to track your or competitor’s company and monitor the marketplace. Generating reports in real-time can be useful to detect and prevent problems before they happen. Setting up ‘request identifier’ lets the employees run the data analysis and generate report on different context at the same time.
You can analyse and report user feedback data using our Excel Add-in, Google Sheets Add-On or Programmatic API. You can generate customer experience reports in Tableau Software too.
