How to measure customer emotions?
Customer emotions can be detected not only from visual content like pictures or voice interactions but also from various texts; user feedback; emails; social media content etc. Although text based emotion detection is related to Sentiment Analysis, there are some significant differences that we should be aware of. Sentiment Analysis aims to detect feelings from the text and categorizes it into positive, neutral or negative categories whereas Emotion Analysis tries to recognize type of feelings embedded into text such as anger, happiness, sadness, surprise etc.
Emotion detection is not an easy task, thankfully it can be achieved using Artificial Intelligence and custom trained models. With TEXT2DATA service you can detect 15 different user emotions. You might also train your own model to detect even more than that.
Emotion reporting on iPhone XR and Samsung s10 phones
As an example, lets analyze two different, popular phones. For the purpose of this article, lets get quickly some data from Twitter using our Excel Add-In.
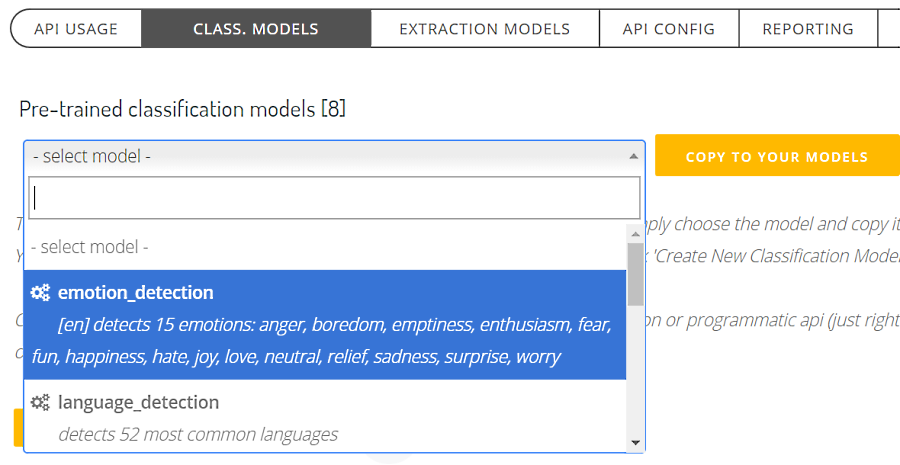
As a first step, lets go to TEXT2DATA user admin panel and copy the emotion detection model to our custom models as below (make sure you set it as your 'default' model)
Downloading Twitter data.
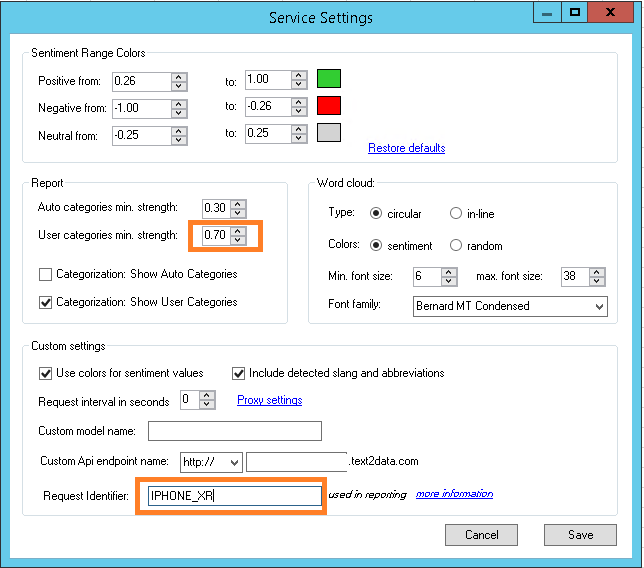
Before we start downloading and analyzing Twitter data, lets set 'Request Identifier' in Excel Add-In service settings to 'IPHONE_XR' and once the iPhone analysis is done, lets switch it to 'SAMSUNG_S10' (before analyzing Samsung). This way the analysis results will be stored along with request identifier context, allowing to separate both analysis data on the report.
Lets also set user category min. strength to 0.7 (probability > 70%) to only show the emotion results that are accurate enough.
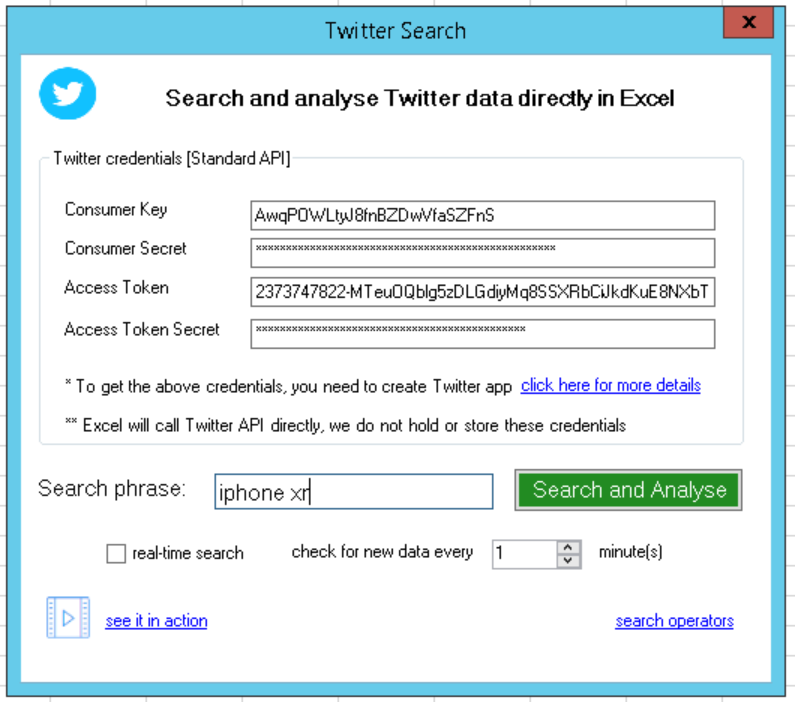
Once we set the above, lets do the search by iPhone XR keyword. We will only download and analyze about 100 tweets per brand for this article.
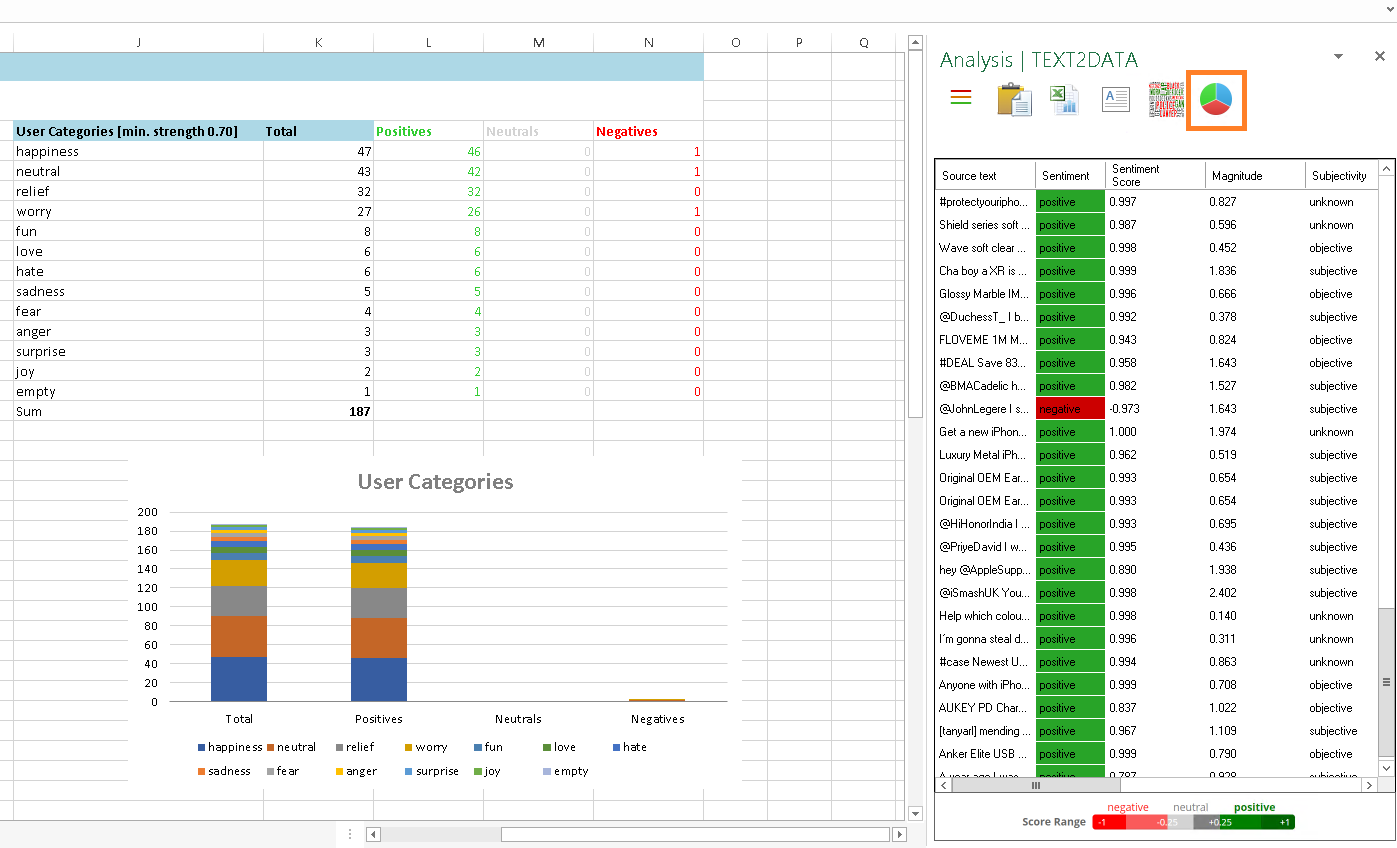
The final iPhone results are pretty greenish.. Once we click on the report summary, the emotion analysis for iPhone XR is being displayed directly in Excel divided into overall text sentiment. As you can see, the sentiment results are not always in line with emotion detection.
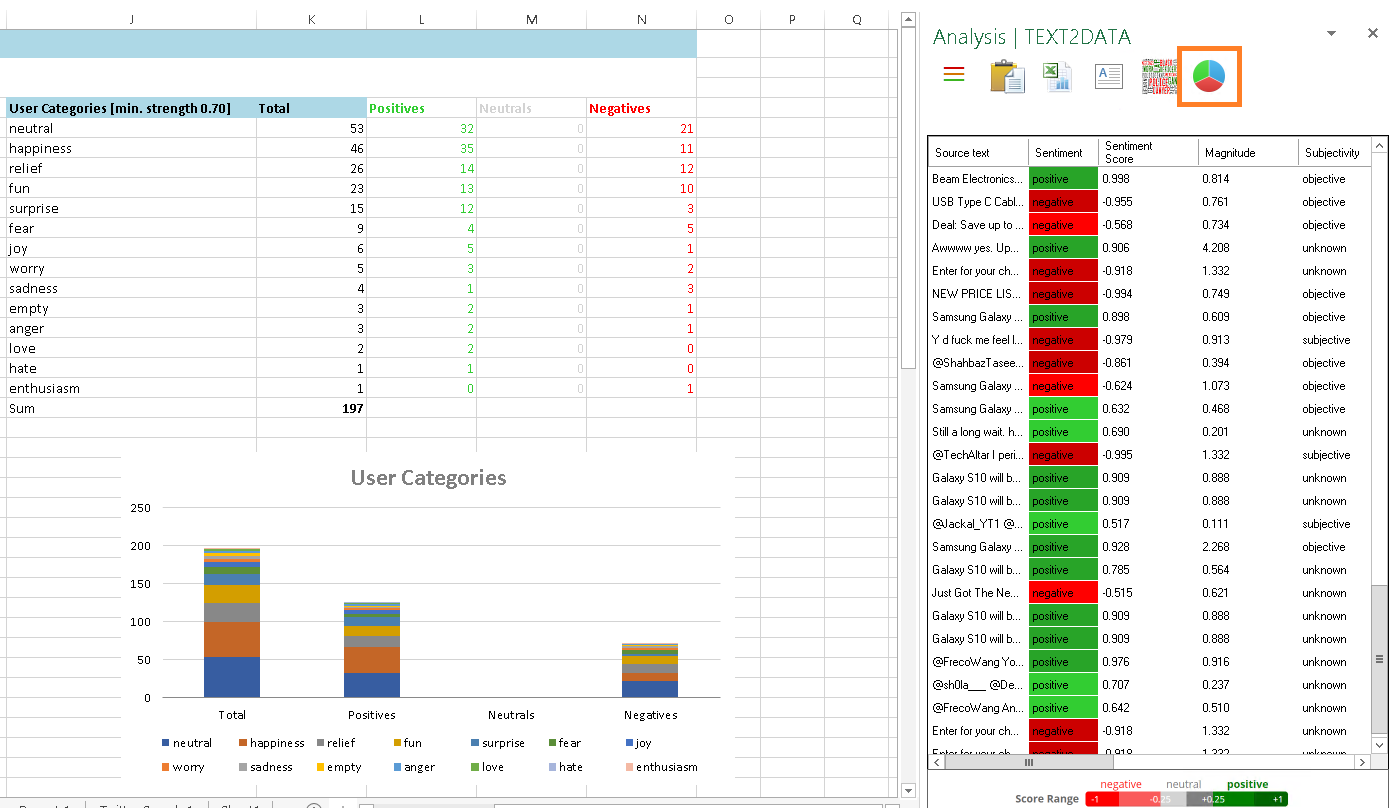
The results on Samsung are clearly different, with much more negative emotions
Emotions reporting in PowerBI
TEXT2DATA users with "Enterprise" subscription have an option to connect to their own dedicated database and create advanced reports on their own. This is where the real flexibility comes in. Lets do that now.
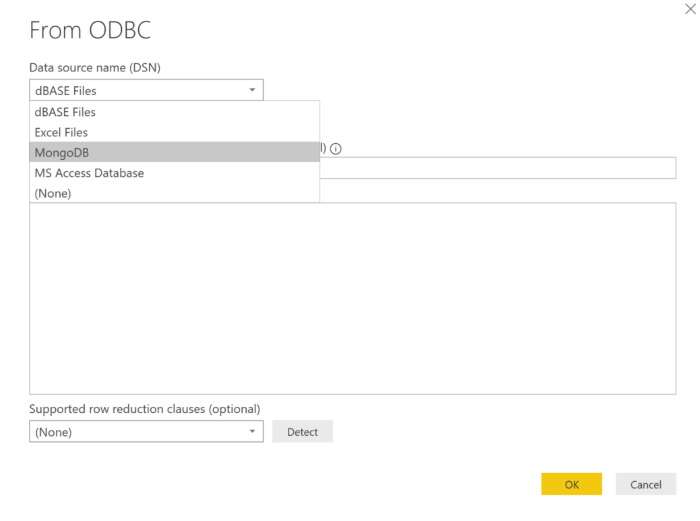
As a first step, we need to connect to our database using ODBC MongoDb provider (lets skip the details for simplicity).
The next step is to open PowerBI desktop application - PowerBI free subscription is enough, no need to go pro unless you need to distribute the reports and have other more advanced options like auto refreshing etc..
Once we are connected to our data source, lets open query editor and navigate to 'StorageInfo.RequestIdentifier' column. The next step is to filter down the data to only operate on our 'IPHONE_XR' and 'SAMSUNG_S10' identifiers that we've set in Excel Add-In before.

Once we have the data filtered, lets design our report.
Some technical stuff is needed here as we need to join our main table 'AnalysisResults' with the table 'AnalysisResults_UserCategories' by '_id' column. The same will have to be done for Samsung and iPhone data separately.
Once this is done, designing the report it's just drag-and-drop operation plus some color and label changes.
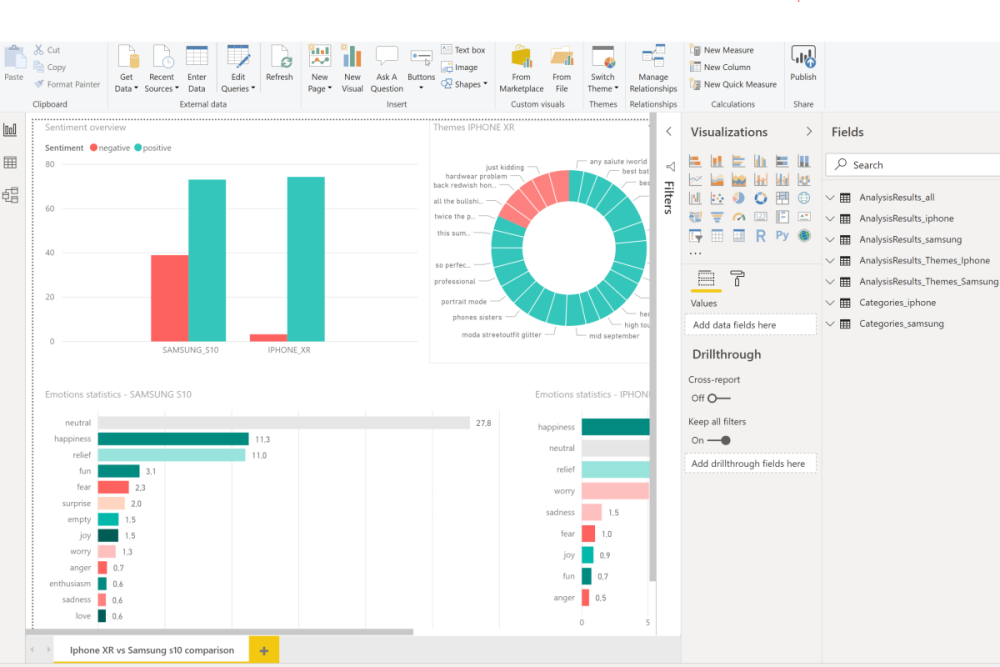
The final report is below
Please note, for this report we only used about 100 tweets per brand. The tweets were not cleaned and were randomly selected.
Despite that, the trend is clearly visible as much more iPhone users are happy with their phone compared to Samsung.
