Sentiment analysis in R.
There are many ways to perform sentiment analysis in R, including external packages. Most of those common methods are based on dictionary lookups that allow to calculate sentiment based on static data. This approach however, does not measure the relations between words and negations being spanned in different parts of the sentence. That often ends up in a lot of false positives, not to mention irony sentences being interpret incorrectly...
"Don't foul yourself thinking detecting positive and negative words based on your dictionary data can get you a proper sentiment analysis accuracy!"

The most accurate sentiment analysis is to be based on machine learning and NLP methods. Calculating RNN (recurrent neural network) vectors based on machine learning model is the way to go.
To achieve that the easiest way, let’s call external api service using pre-trained NLP model directly from R environment.
Training the models in our system is the manual process - this allows to achieve the best accuracy.
In order to train your custom sentiment analysis model, you might use our SMTT tool
Let’s do some coding now. For the purpose of this article, we use Microsoft R Tools (part of the Visual Studio components).
Once this is installed, we open R Interactive window and attach debugger.
Next step is to create free account at text2data.com in order to get the api key and secret.
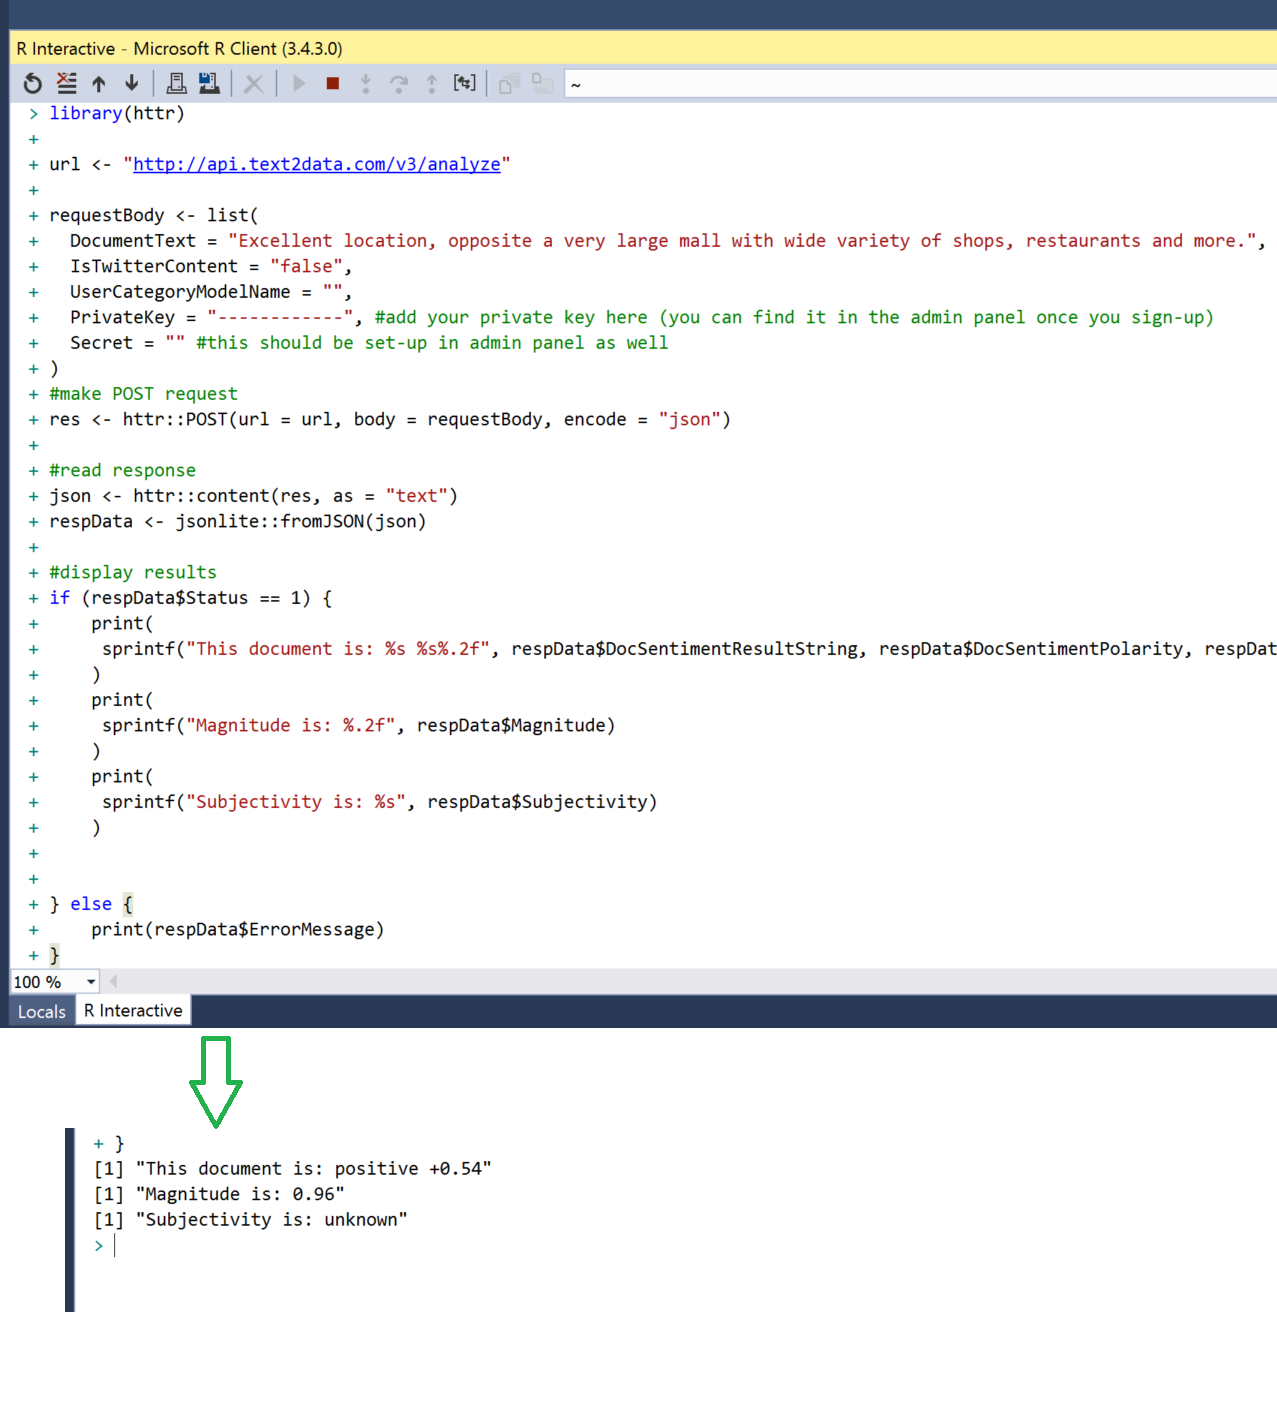
Once you get that, just configure the script below with these api key and secret and hit enter!
                                library(httr)

                                url <- "http://api.text2data.com/v3/analyze"
                                       requestBody <- list(
                                  DocumentText = "Excellent location, opposite a very large mall with wide variety of shops, restaurants and more.",
                                  IsTwitterContent = "false",
                                  UserCategoryModelName = "",
                                  PrivateKey = "------------",#add your private key here (you can find it in the admin panel once you sign-up)
                                  Secret= "" #this should be set-up in admin panel as well
                                )
                                #make POST request
                                res <- httr::POST(url = url,body = requestBody, encode = "json")

                                #read response
                                json <- httr::content(res, as = "text")
                                respData <- jsonlite::fromJSON(json)

                                #display results
                                if(respData$Status == 1)
                                {
	                                print(
	                                 sprintf("This document is: %s %s%.2f", respData$DocSentimentResultString, respData$DocSentimentPolarity, respData$DocSentimentValue)
	                                )
	                                print(
	                                 sprintf("Magnitude is: %.2f", respData$Magnitude)
	                                )
	                                print(
	                                 sprintf("Subjectivity is: %s", respData$Subjectivity)
	                                )


                                } else{
                                   print(respData$ErrorMessage)
                                }
You might want to create separate function based on the below code sample - this will allow you to iterate over your data records and display the graphical charts based on aggregated sentiment results.

